> ## Documentation Index
> Fetch the complete documentation index at: https://www.marqeta.com/docs/llms.txt
> Use this file to discover all available pages before exploring further.
# Reporting and Insights
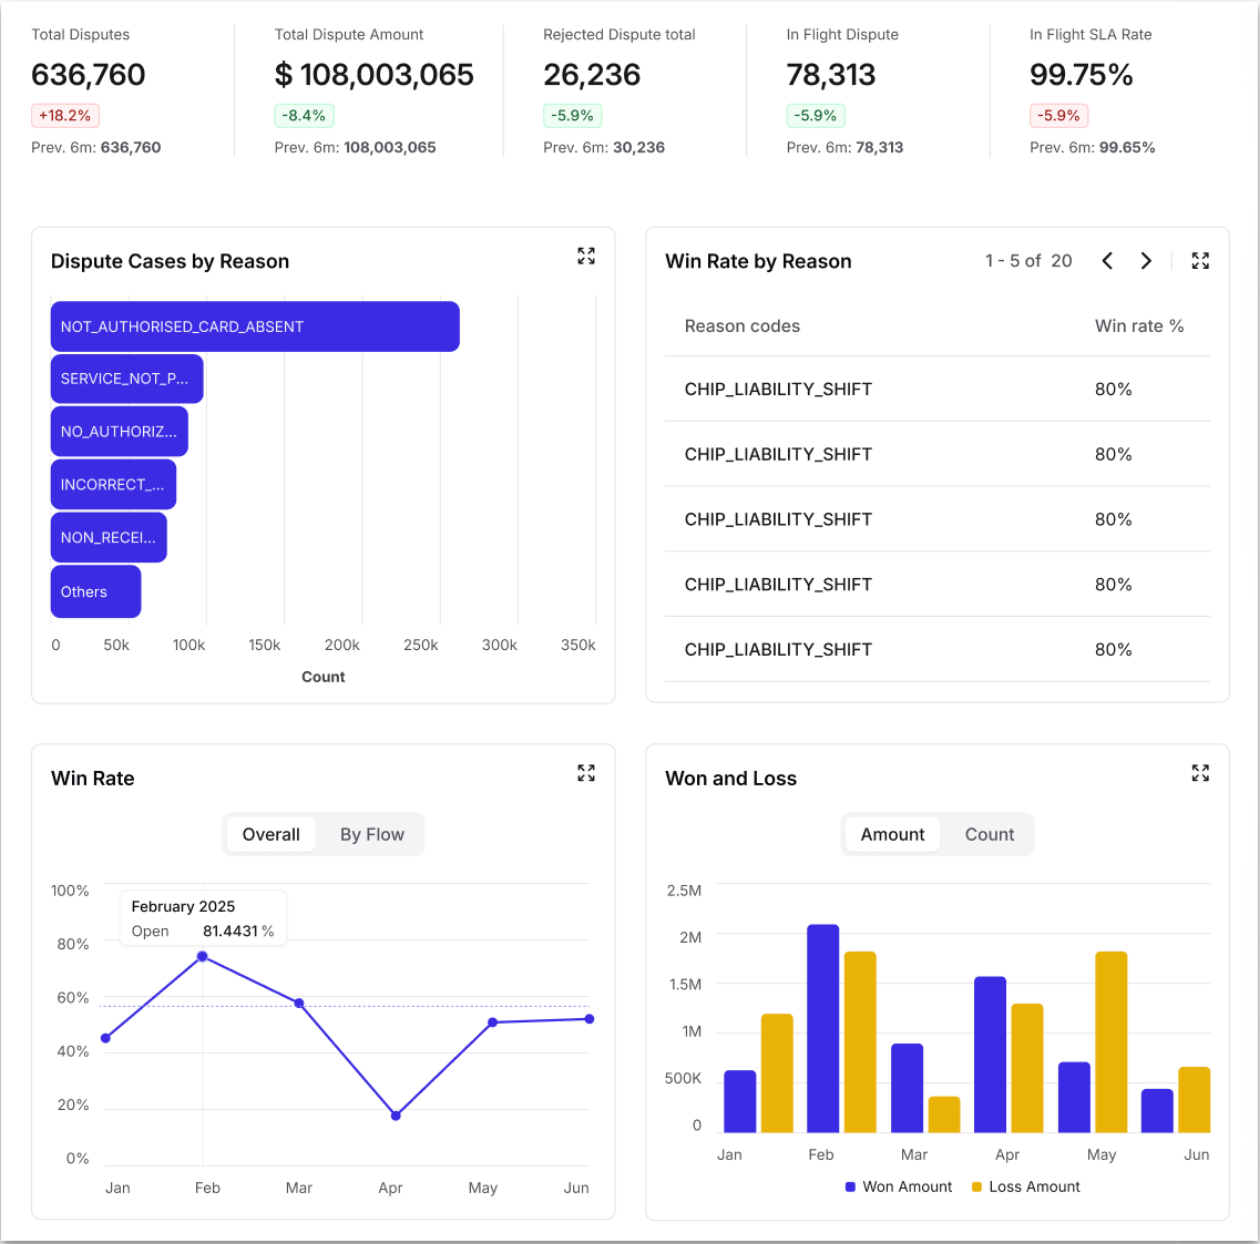
> Monitor dispute performance in the Disputes portal using dashboards that track case status, wins and losses, reject rate, dispute volume, and win rate.
The Disputes portal includes reporting and analytics tools that help you monitor dispute performance and identify trends.
This guide explains how to customize a report's view and describes the insights each report provides.
Customizing your view
Each report widget includes an expand icon in its top right corner.
Click the expand icon to view a report in full-screen mode, where you can access additional detail and interactive features.
Use the filters in the top right to adjust what a report shows:
* **Group by** — Set the time grouping, such as month.
* **Period** — Set the date range, such as the last six months.
Available reports
The following are the available reports in the Disputes portal.
Status over time
See how cases are distributed across stages over time.
This report helps you track how cases move through the lifecycle, monitor month-over-month trends, and identify bottlenecks in your workflow.
Wins and losses
Compare won versus lost cases by count and by amount.
Use it to analyze monthly performance, understand the financial impact of dispute outcomes, and track recovery rates over time.
Reject rate
Monitor case rejection trends.
This report helps you spot periods with higher rejection rates, track improvements in case quality over time, and set benchmarks for operational performance.
Dispute cases by reason
Identify which dispute types are most common.
Use it to focus training and resources on high-volume categories, track changes in reason code distribution over time, and prioritize process improvements for frequent dispute types.
Disputes over time
Track dispute volume and monetary value by month.
You can switch between count and volume views to identify seasonal patterns, spot fluctuations, and monitor growth or decline in dispute activity.
Win rate
Monitor your success rate in dispute resolution over time.
Compare overall performance against win rate by flow type, track improvement or decline in outcomes, and set targets based on historical performance.
Win rate by reason
Break down success rates by specific dispute reason codes.
Use it to identify which dispute types you win most often and focus improvement efforts on low-performing categories.
## Related topics
- [Reporting Overview](/docs/developer-guides/reporting-landing-page.md)
- [Data Products and Insights](/docs/developer-guides/data-products-and-insights.md)
- [About Reporting](/docs/developer-guides/about-reporting.md)
- [About the Disputes Portal](/docs/developer-guides/about-disputes-portal.md)
- [2023 Release Notes](/docs/developer-guides/release-notes-2023.md)